部署模型
使用 vetiver 包可以快速实现模型部署。
这段代码包含了几个主要步骤:
数据集的划分 :使用tidymodels包中的initial_split()函数将taxi数据集划分为训练集和测试集,其中80%的数据用于训练,剩余20%的数据用于测试。这个划分是根据tip列(应该是目标变量)进行分层的。
── Attaching packages ────────────────────────────────────── tidymodels 1.1.1 ──
✔ broom        1.0.5     ✔ recipes      1.0.9
✔ dials        1.2.0     ✔ rsample      1.2.0
✔ dplyr        1.1.4     ✔ tibble       3.2.1
✔ ggplot2      3.4.4     ✔ tidyr        1.3.0
✔ infer        1.0.5     ✔ tune         1.1.2
✔ modeldata    1.2.0     ✔ workflows    1.1.3
✔ parsnip      1.1.1     ✔ workflowsets 1.0.1
✔ purrr        1.0.2     ✔ yardstick    1.2.0
── Conflicts ───────────────────────────────────────── tidymodels_conflicts() ──
✖ purrr::discard() masks scales::discard()
✖ dplyr::filter()  masks stats::filter()
✖ dplyr::lag()     masks stats::lag()
✖ recipes::step()  masks stats::step()
• Use tidymodels_prefer() to resolve common conflicts.
set.seed (123 )<- initial_split (taxi, prop = 0.8 , strata = tip)<- training (taxi_split)<- testing (taxi_split)
模型的定义和训练 :定义了一个决策树模型规格(使用decision_tree()函数),并设置了成本复杂度参数为0.0001,模式为”分类”。然后,使用workflow()函数创建了一个工作流,指定了目标变量和预测器,并用训练集拟合了这个工作流。
<- decision_tree (cost_complexity = 0.0001 , mode = "classification" )<- workflow (tip ~ ., tree_spec) %>% fit (taxi_train)
模型部署准备 :使用vetiver包的vetiver_model()函数创建了一个vetiver模型对象,这是对已经拟合的模型进行封装,为模型的部署做准备。
## Deploying a model library (vetiver)
The following object is masked from 'package:tune':

    load_pkgs
<- vetiver_model (tree_fit, "taxi" )
── taxi ─ <bundled_workflow> model for deployment
A rpart classification modeling workflow using 6 features
建立API :使用plumber包提供的pr()函数创建了一个新的Plumber API,然后利用vetiver_api(v)将vetiver模型对象转化为一个API端点。这样就可以通过这个API来调用我们的机器学习模型。
## Deploy your model library (plumber)pr () %>% vetiver_api (v)
# Plumber router with 4 endpoints, 4 filters, and 1 sub-router.
# Use `pr_run()` on this object to start the API.
├──[queryString]
├──[body]
├──[cookieParser]
├──[sharedSecret]
├──/logo
│  │ # Plumber static router serving from directory: /Library/Frameworks/R.framework/Versions/4.3-arm64/Resources/library/vetiver
├──/metadata (GET)
├──/ping (GET)
├──/predict (POST)
└──/prototype (GET)
以上就是代码的基本解释。如果你想要实际部署这个模型,你需要将这个Plumber API部署到一个可以提供HTTP服务的服务器上,例如 RStudio Connect。
编码的影响
这段代码执行了以下操作:
数据预处理 : 你加载了一个叫做hotel_rates的数据集,并从中随机选择了5000行。然后,你对这个数据集进行了一些预处理,包括去除arrival_date列,以及将company、country和agent列转换为因子类型。
data (hotel_rates)set.seed (295 )<- %>% sample_n (5000 ) %>% arrange (arrival_date) %>% select (- arrival_date) %>% mutate (company = factor (as.character (company)),country = factor (as.character (country)),agent = factor (as.character (agent))
数据划分 : 你使用tidymodels包的initial_split()函数将数据集划分为训练集和测试集,其中划分是基于avg_price_per_room列进行的。
set.seed (4028 )<- initial_split (hotel_rates, strata = avg_price_per_room)<- training (hotel_split)<- testing (hotel_split)
交叉验证 : 你设置了一个10折交叉验证(默认设置)的数据集,也是基于avg_price_per_room列进行的。
set.seed (472 )<- vfold_cv (hotel_train, strata = avg_price_per_room)
特征工程 : 你计算了每个代理的平均房价(ADR)和预订数量。然后,你使用了embed包的step_lencode_mixed()函数来对agent列进行混合编码。这个函数根据目标变量的值来计算每个级别的概率,并用这个概率来替换原始的分类变量。
<- %>% group_by (agent) %>% summarize (ADR = mean (avg_price_per_room), num_reservations = n (),.groups = "drop" %>% mutate (agent = reorder (agent, ADR))library (embed)<- recipe (avg_price_per_room ~ ., data = hotel_train) %>% step_lencode_mixed (agent, outcome = vars (avg_price_per_room), id = "encoding" ) %>% step_dummy (all_nominal_predictors ()) %>% step_zv (all_predictors ()) %>% step_normalize (all_numeric_predictors ()) %>% prep () %>% tidy (id = "encoding" ) %>% select (agent = level, estimate = value)
为了得到 estimates 的值,依次执行了以下操作:
创建预处理配方 :使用recipe()函数创建一个预处理配方,指定要根据所有其他变量来预测的目标avg_price_per_room。
混合编码 :使用step_lencode_mixed()函数对agent进行混合编码。这个函数会计算每个级别的效应大小,并用这个效应大小替换原始分类变量的值。这是一种处理分类变量的方法,可以将分类变量的每个级别与目标变量的某种统计量(如均值)关联起来。
哑变量编码 :使用step_dummy()函数对所有的名义预测变量进行哑变量编码。这会为每个分类变量的每个级别创建一个新的二元变量。
移除零方差预测变量 :使用step_zv()函数移除所有的零方差预测变量。这些变量在所有观测中的值都是相同的,因此不包含任何有用的信息。
归一化 :使用step_normalize()函数对所有的数值预测变量进行归一化。这会将每个变量的值转换为其Z分数,即减去均值然后除以标准差。
准备配方 :使用prep()函数准备(即训练)这个配方。这会使配方学习到训练数据的特性,例如各变量的均值和标准差等。
提取编码估计值 :使用tidy()函数和select()函数提取混合编码的估计值,并将结果保存在estimates中。这个数据框包含两列:agent(原始的级别)和estimate(对应的效应大小)。
模型训练与评估 : 你定义了一个线性回归模型,并在上面应用了你的预处理步骤。然后,你在交叉验证的数据集上拟合了这个模型,并收集了每个折叠的度量结果。
<- recipe (avg_price_per_room ~ ., data = hotel_train) %>% step_YeoJohnson (lead_time) %>% step_lencode_mixed (agent, company, outcome = vars (avg_price_per_room)) %>% step_dummy (all_nominal_predictors ()) %>% step_zv (all_predictors ())<- workflow () %>% add_model (linear_reg ()) %>% update_recipe (hotel_effect_rec)
Warning: The workflow has no recipe preprocessor to remove.
<- metric_set (mae, rsq)<- %>% fit_resamples (hotel_rs, metrics = reg_metrics)
→ A | warning: prediction from rank-deficient fit; consider predict(., rankdeficient="NA")
There were issues with some computations   A: x1
There were issues with some computations   A: x1
collect_metrics (hotel_effect_res)
# A tibble: 2 × 6
  .metric .estimator   mean     n std_err .config
  <chr>   <chr>       <dbl> <int>   <dbl> <chr>
1 mae     standard   17.8      10 0.189   Preprocessor1_Model1
2 rsq     standard    0.870    10 0.00357 Preprocessor1_Model1
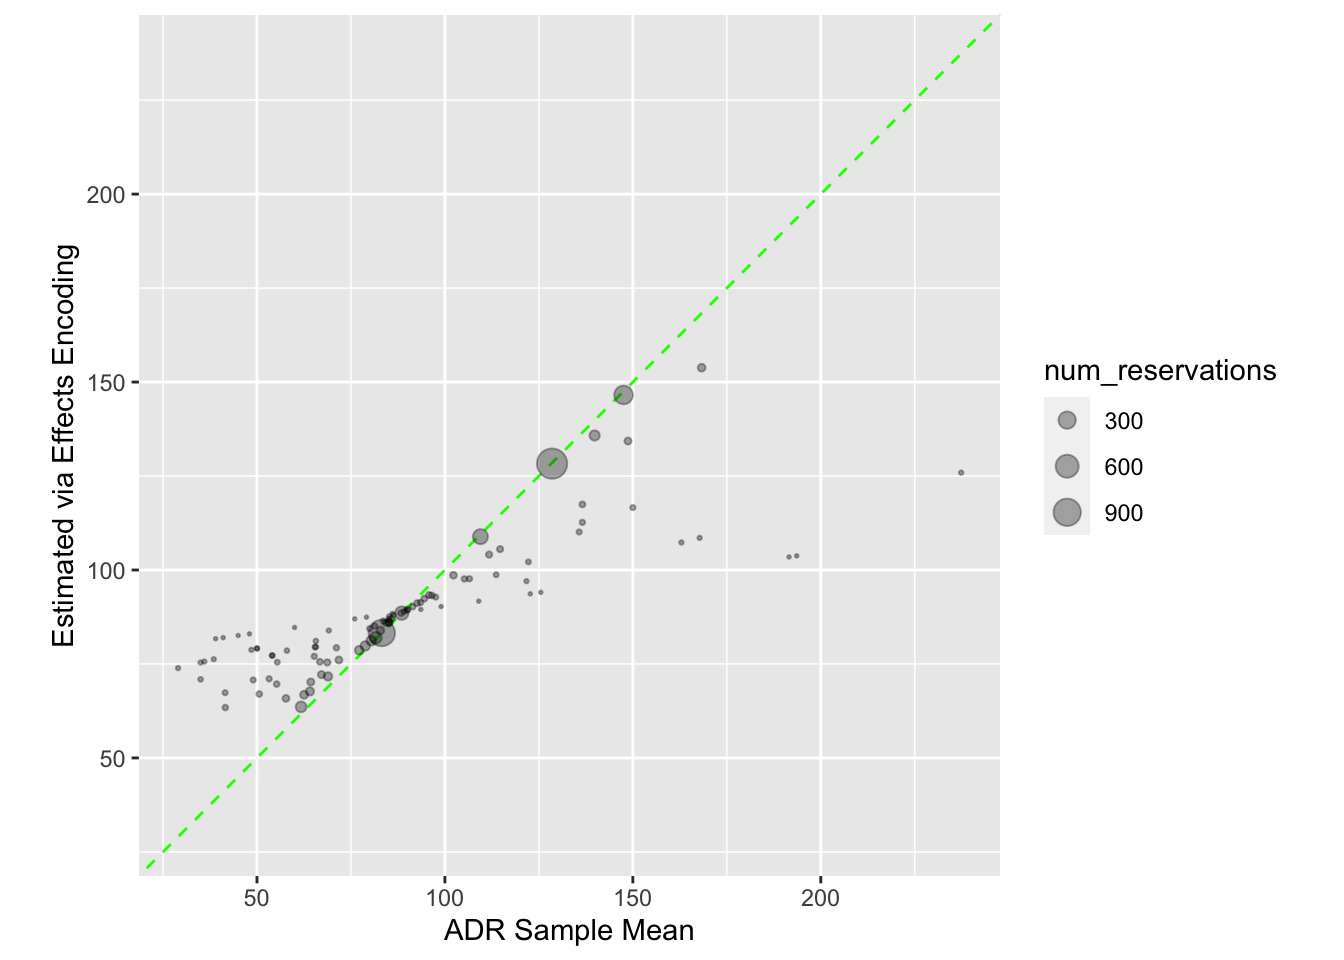
可视化 : 在这个过程中,你创建了几个直方图来可视化agent_stats数据,以及一个散点图来比较ADR的样本均值和通过效果编码估计的值。
<- hotel_train %>% select (avg_price_per_room, agent) %>% slice (1 : 7 ) %>% add_rowindex ()
# A tibble: 7 × 3
  avg_price_per_room agent            .row
               <dbl> <fct>           <int>
1               52.7 cynthia_worsley     1
2               51.8 carlos_bryant       2
3               53.8 lance_hitchcock     3
4               51.8 lance_hitchcock     4
5               46.8 cynthia_worsley     5
6               54.7 charles_najera      6
7               46.8 cynthia_worsley     7
<- left_join (before, estimates, by = "agent" ) %>% select (avg_price_per_room, agent = estimate, .row)
# A tibble: 7 × 3
  avg_price_per_room agent  .row
               <dbl> <dbl> <int>
1               52.7  88.5     1
2               51.8  89.5     2
3               53.8  79.8     3
4               51.8  79.8     4
5               46.8  88.5     5
6               54.7 109.      6
7               46.8  88.5     7
%>% ggplot (aes (x = num_reservations)) + geom_histogram (bins = 30 , col = "blue" , fill = "blue" , alpha = 1 / 3 ) + labs (x = "Number of reservations per agent" )%>% ggplot (aes (x = ADR)) + geom_histogram (bins = 30 , col = "red" , fill = "red" , alpha = 1 / 3 ) + labs (x = "Average ADR per agent" )%>% ggplot (aes (x = num_reservations)) + geom_histogram (bins = 30 , col = "blue" , fill = "blue" , alpha = 1 / 3 ) + labs (x = "Number of reservations per agent" )%>% ggplot (aes (x = ADR)) + geom_histogram (bins = 30 , col = "red" , fill = "red" , alpha = 1 / 3 ) + labs (x = "Average ADR per agent" )inner_join (agent_stats, estimates, by = "agent" ) %>% ggplot (aes (x = ADR, y = estimate)) + geom_abline (col = "green" , lty = 2 ) + geom_point (aes (size = num_reservations), alpha = 1 / 3 ) + coord_obs_pred () + scale_size (range = c (1 / 3 , 5 )) + labs (x = "ADR Sample Mean" , y = "Estimated via Effects Encoding" )
这段代码是一个完整的机器学习工作流程的实例,包括数据预处理、特征工程、模型训练和评估等步骤。它展示了如何使用R和一些关键的数据科学包(如tidymodels和embed)来进行复杂的数据分析和建模任务。


