── Attaching packages ────────────────────────────────────── tidymodels 1.1.1 ──
✔ broom        1.0.5     ✔ recipes      1.0.9
✔ dials        1.2.0     ✔ rsample      1.2.0
✔ dplyr        1.1.4     ✔ tibble       3.2.1
✔ ggplot2      3.4.4     ✔ tidyr        1.3.0
✔ infer        1.0.5     ✔ tune         1.1.2
✔ modeldata    1.2.0     ✔ workflows    1.1.3
✔ parsnip      1.1.1     ✔ workflowsets 1.0.1
✔ purrr        1.0.2     ✔ yardstick    1.2.0
── Conflicts ───────────────────────────────────────── tidymodels_conflicts() ──
✖ purrr::discard() masks scales::discard()
✖ dplyr::filter()  masks stats::filter()
✖ dplyr::lag()     masks stats::lag()
✖ recipes::step()  masks stats::step()
• Learn how to get started at https://www.tidymodels.org/start/
会使用 R 语言中的管道命令 %>% 或者 |>
用过这几个软件包:dplyr, tidyr, ggplot2
了解基本的统计学概念
现在不懂,但是想学习模型或者机器学习
基础的 tidymodels 知识包括下面几点:
安装需要的软件包
安装下面的这些软件包,以便完成上面列举的任务。
# Install the packages for the workshop <- c ("bonsai" , "doParallel" , "embed" , "finetune" , "lightgbm" , "lme4" ,"plumber" , "probably" , "ranger" , "rpart" , "rpart.plot" , "rules" ,"splines2" , "stacks" , "text2vec" , "textrecipes" , "tidymodels" , "vetiver" , "remotes" ):: pak (pkgs)
数据预处理
modeldata 包提供了一些示例数据集,用于在 tidymodels 中进行模型建设和演示。其中 “taxi” 数据集是一个简化的示例数据集,描述了芝加哥出租车司机获得小费的情况。
其详细信息可以使用以下代码查看:
# A tibble: 10,000 × 7
   tip   distance company                      local dow   month  hour
   <fct>    <dbl> <fct>                        <fct> <fct> <fct> <int>
 1 yes      17.2  Chicago Independents         no    Thu   Feb      16
 2 yes       0.88 City Service                 yes   Thu   Mar       8
 3 yes      18.1  other                        no    Mon   Feb      18
 4 yes      20.7  Chicago Independents         no    Mon   Apr       8
 5 yes      12.2  Chicago Independents         no    Sun   Mar      21
 6 yes       0.94 Sun Taxi                     yes   Sat   Apr      23
 7 yes      17.5  Flash Cab                    no    Fri   Mar      12
 8 yes      17.7  other                        no    Sun   Jan       6
 9 yes       1.85 Taxicab Insurance Agency Llc no    Fri   Apr      12
10 yes       1.47 City Service                 no    Tue   Mar      14
# ℹ 9,990 more rows
包含的变量有:
tip:乘客是否留下小费。 “yes” 或 “no”。distance:行程距离,以英里为单位。company:出租车公司。出现次数较少的公司被分为 “other”。local:行程是否在同一社区区域开始和结束。dow:行程开始的星期几。month:行程开始的月份。hour:行程开始的小时。
这个数据一共有 10000 行。
拆分数据
在机器学习中,数据集主要分为以下几种类型:
训练集(Training Set):
定义: 用于训练模型的数据集。作用: 模型通过训练集学习特征和模式,调整参数以最小化预测错误。 验证集(Validation Set):
定义: 用于调整模型超参数、选择模型或防止过拟合的数据集。作用: 通过在验证集上评估模型性能,进行超参数调整和模型选择。 测试集(Test Set):
定义: 用于评估模型在未见过的数据上的性能的数据集。作用: 测试集提供了模型在真实场景中的泛化能力的估计。
使用 initial_split() 将数据拆分成训练集和测试集。
set.seed (123 )library (rsample)# random split <- initial_split (taxi))
<Training/Testing/Total>
<7500/2500/10000>
# access to split data <- training (taxi_split))
# A tibble: 7,500 × 7
   tip   distance company                   local dow   month  hour
   <fct>    <dbl> <fct>                     <fct> <fct> <fct> <int>
 1 yes       0.7  Taxi Affiliation Services yes   Tue   Mar      18
 2 yes       0.99 Sun Taxi                  yes   Tue   Jan       8
 3 yes       1.78 other                     no    Sat   Mar      22
 4 yes       0    Taxi Affiliation Services yes   Wed   Apr      15
 5 yes       0    Taxi Affiliation Services no    Sun   Jan      21
 6 yes       2.3  other                     no    Sat   Apr      21
 7 yes       6.35 Sun Taxi                  no    Wed   Mar      16
 8 yes       2.79 other                     no    Sun   Feb      14
 9 yes      16.6  other                     no    Sun   Apr      18
10 yes       0.02 Chicago Independents      yes   Sun   Apr      15
# ℹ 7,490 more rows
<- testing (taxi_split))
# A tibble: 2,500 × 7
   tip   distance company                      local dow   month  hour
   <fct>    <dbl> <fct>                        <fct> <fct> <fct> <int>
 1 yes       0.94 Sun Taxi                     yes   Sat   Apr      23
 2 yes       1    Taxi Affiliation Services    no    Mon   Feb      18
 3 yes       1.91 Flash Cab                    no    Wed   Apr      15
 4 yes       1.1  Chicago Independents         no    Sat   Mar      10
 5 yes      11.7  other                        no    Wed   Mar      18
 6 yes      17.8  City Service                 no    Mon   Mar       9
 7 yes       0.53 Taxicab Insurance Agency Llc yes   Wed   Apr       8
 8 yes       1.14 City Service                 no    Wed   Mar      14
 9 yes       1.77 other                        no    Thu   Apr      15
10 yes      18.6  Flash Cab                    no    Thu   Apr      12
# ℹ 2,490 more rows
使用 initial_validation_split() 将数据拆分成训练集、验证集和测试集。
set.seed (123 )taxi_split_2 = initial_validation_split (taxi, prop = c (0.6 , 0.2 )))
<Training/Validation/Testing/Total>
<6000/2000/2000/10000>
# A tibble: 6,000 × 7
   tip   distance company                      local dow   month  hour
   <fct>    <dbl> <fct>                        <fct> <fct> <fct> <int>
 1 yes      17.2  Chicago Independents         no    Thu   Feb      16
 2 yes      20.7  Chicago Independents         no    Mon   Apr       8
 3 yes      12.2  Chicago Independents         no    Sun   Mar      21
 4 yes       1.85 Taxicab Insurance Agency Llc no    Fri   Apr      12
 5 yes       0.53 Sun Taxi                     no    Tue   Mar      18
 6 yes      16.8  Sun Taxi                     no    Wed   Apr      12
 7 yes       0.86 other                        no    Tue   Feb      13
 8 no        0.4  other                        yes   Fri   Mar      17
 9 yes       0.1  Taxi Affiliation Services    no    Sun   Apr      10
10 yes       1.6  Taxi Affiliation Services    no    Tue   Apr       8
# ℹ 5,990 more rows
# A tibble: 2,000 × 7
   tip   distance company                      local dow   month  hour
   <fct>    <dbl> <fct>                        <fct> <fct> <fct> <int>
 1 yes       0.88 City Service                 yes   Thu   Mar       8
 2 yes       1.47 City Service                 no    Tue   Mar      14
 3 yes       1    other                        no    Fri   Mar      17
 4 yes       1.35 Taxicab Insurance Agency Llc no    Thu   Feb      17
 5 yes       1.14 City Service                 no    Wed   Mar      14
 6 yes       1.77 other                        no    Thu   Apr      15
 7 no        1.07 Sun Taxi                     no    Fri   Feb      15
 8 no        1.13 other                        no    Sat   Feb      14
 9 yes      12.1  Chicago Independents         no    Tue   Jan      11
10 yes       1.91 Sun Taxi                     no    Tue   Jan      17
# ℹ 1,990 more rows
# A tibble: 2,000 × 7
   tip   distance company                      local dow   month  hour
   <fct>    <dbl> <fct>                        <fct> <fct> <fct> <int>
 1 yes      18.1  other                        no    Mon   Feb      18
 2 yes       0.94 Sun Taxi                     yes   Sat   Apr      23
 3 yes      17.5  Flash Cab                    no    Fri   Mar      12
 4 yes      17.7  other                        no    Sun   Jan       6
 5 yes       6.65 Taxicab Insurance Agency Llc no    Sun   Apr      11
 6 yes       1.21 Sun Taxi                     yes   Thu   Apr      19
 7 yes       1    Taxi Affiliation Services    no    Mon   Feb      18
 8 yes       1.91 Flash Cab                    no    Wed   Apr      15
 9 yes       1.1  Chicago Independents         no    Sat   Mar      10
10 no        0.96 Taxicab Insurance Agency Llc no    Mon   Apr       8
# ℹ 1,990 more rows
使用函数的 strata、prop 参数,以及 initial_time_split()、group_initial_split() 等函数,可以实现更科学的随机分组。
模型的结构
在 R 中使用 tidymodels 进行建模的基本步骤如下:
选择模型:
选择适合任务的模型,例如线性回归、决策树、随机森林等。
指定引擎:
指定模型使用的引擎,如 “lm” 或 “glmnet”。
设置模型模式:
Models have default engines.
Some models have a default mode.
# 使用默认引擎的逻辑回归模型 logistic_reg ()
Logistic Regression Model Specification (classification)

Computational engine: glm
# 使用 glmnet 引擎的逻辑回归模型 logistic_reg () %>% set_engine ("glmnet" )
Logistic Regression Model Specification (classification)

Computational engine: glmnet
# 使用 stan 引擎的逻辑回归模型 logistic_reg () %>% set_engine ("stan" )
Logistic Regression Model Specification (classification)

Computational engine: stan
# 未指定模式的决策树 decision_tree ()
Decision Tree Model Specification (unknown mode)

Computational engine: rpart
# 指定分类模式的决策树 decision_tree () %>% set_mode ("classification" )
Decision Tree Model Specification (classification)

Computational engine: rpart
模型与引擎的差异
在 tidymodels 中,模型和计算引擎是分开的。这允许你使用相同的模型规格,但可以选择用于训练模型的不同算法或程序包。
模型引擎 是指用于实现特定类型模型的软件(通常是一个R包)。例如,对于线性回归模型,可能的引擎包括"lm"、"glmnet"、"spark"等,每个都对应不同的实现方法。
不同的引擎可能会有以下几种差异:
计算效率 :一些引擎可能在大数据集上更有效率,而其他引擎在小数据集上可能更快。功能 :一些引擎可能只支持某些特定的功能。例如,"glmnet"引擎支持L1和L2正则化,而"lm"引擎则不支持。可扩展性 :某些引擎(如"spark")可能被设计为可以在分布式计算环境中运行,从而处理大规模数据集。结果 :由于采用的优化算法和随机初始化等因素的影响,不同引擎可能会得到略微不同的结果。
总的来说,选择哪个引擎并没有固定的答案,取决于具体的需求和环境。你可能需要根据计算资源、数据大小和模型复杂性等因素来选择最适合的引擎。
例如,下面使用两种不同的ß引擎创建了随机森林模型。
在 tidymodels 中,创建随机森林模型规格可以使用 rand_forest() 函数。但是,具体的训练过程会由你选择的计算引擎决定。下面是两个例子,分别说明了如何使用 "ranger" 引擎和 "randomForest" 引擎。
使用 "ranger" 引擎:
library (tidymodels)# 创建模型规格 <- rand_forest (mtry = 10 , trees = 1000 ) %>% set_engine ("ranger" , importance = 'impurity' ) %>% set_mode ("classification" )# 训练模型 <- rf_spec %>% fit (Class ~ ., data = your_data)在这里,我们设置了 mtry = 10(即每个树节点考虑的变量数)和 trees = 1000(生成的树的数量)。然后我们指定了引擎为 "ranger"。ranger 包提供了一个参数 importance,用于计算变量重要性(这里我们设为 ‘impurity’,表示计算基于不纯度的变量重要性)。
使用 "randomForest" 引擎:
# 创建模型规格 <- rand_forest (mtry = 10 , trees = 1000 ) %>% set_engine ("randomForest" , importance = TRUE ) %>% set_mode ("classification" )# 训练模型 <- rf_spec %>% fit (Class ~ ., data = your_data)在这个例子中,我们指定了引擎为 "randomForest"。randomForest 包提供了一个参数 importance,如果设置为 TRUE,则计算变量重要性。
两个引擎的主要区别在于:
"ranger" 引擎通常比 "randomForest" 引擎更快,且能处理更大的数据集。"ranger" 引擎提供了更多的选项来计算变量重要性。
最终的模型结果可能会有些微小的差异,因为这两个包在实现随机森林时使用了不同的方法和优化技术。
开始建模
使用 2 种模型对 taxi 数据进行建模。
Logistic regression
Decision trees
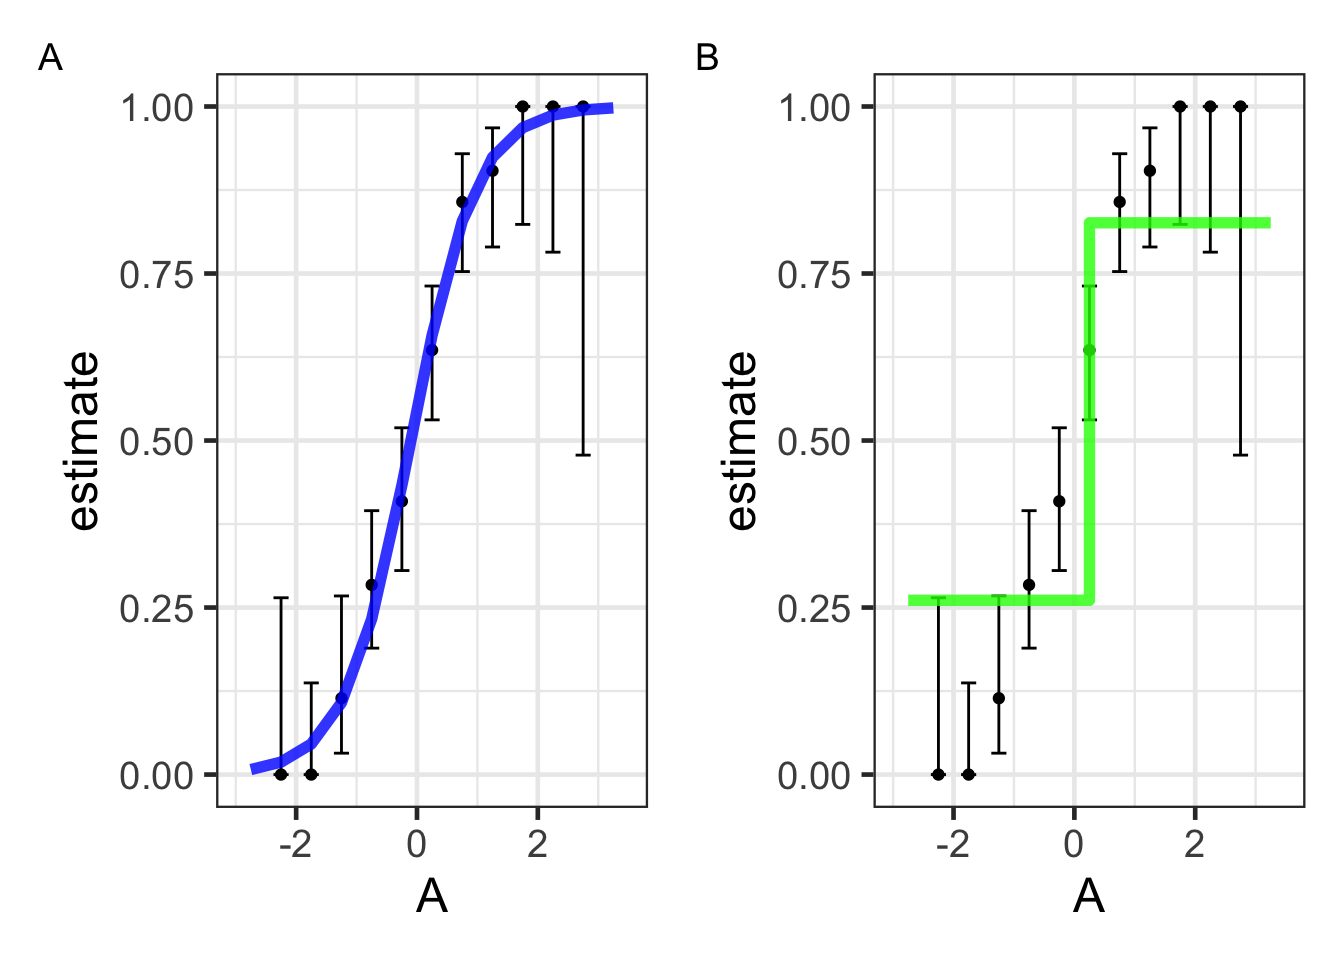
逻辑回归模型
逻辑回归模型将事件概率的对数几率(logit)建模为预测变量的线性组合:
\log\left(\frac{p}{1 - p}\right) = \beta_0 + \beta_1 \cdot A
在这里:
p 是事件发生的概率,\beta_0 是截距,\beta_1 是与预测变量 A 相关的系数。
决策树
使用决策树建模。
基于预测变量的一系列划分或 if/then 语句:
首先,树会在满足某些条件之前(如达到最大深度或没有更多数据时)不断地“生长”(grow)。
然后,为了降低树的复杂性,树会被“修剪”(pruned)。
<- decision_tree (mode = "classification" ) %>% fit (class ~ A, data = mutate (dat, class = forcats:: fct_rev (class)))<- augment (tree_fit, new_data = bin_midpoints)library (rpart.plot)
The following object is masked from 'package:dials':

    prune
%>% extract_fit_engine () %>% rpart.plot (roundint = FALSE )
建模的效果如下:
All models are wrong, but some are useful!
将模型整合为 workflow
使用 workflow() 有一些明显的优势(Figure 1.3 )。
Workflow 在处理新数据方面比基本的 R 工具更加灵活,尤其是在涉及新的因子水平时:这在处理分类变量时尤为重要。
可以使用更多的数据预处理器来提取特征(在高级 tidymodels 中更多关于特征提取的内容!)
便于同时处理多个模型。
最重要的是,Workflow 涵盖了整个建模过程:fit() 和 predict() 不仅适用于模型拟合,还适用于预处理步骤。
强制执行不允许在预测时出现新因子水平的规定(可以关闭)
恢复在拟合时存在但在预测时缺失的因子水平
经典方法
<- decision_tree (cost_complexity = 0.002 ) %>% set_mode ("classification" )%>% fit (tip ~ ., data = taxi_train)
parsnip model object

n= 7500

node), split, n, loss, yval, (yprob)
      * denotes terminal node

 1) root 7500 579 yes (0.92280000 0.07720000)
   2) distance>=11.805 2169  83 yes (0.96173352 0.03826648) *
   3) distance< 11.805 5331 496 yes (0.90695929 0.09304071)
     6) distance< 5.405 5061 419 yes (0.91721004 0.08278996) *
     7) distance>=5.405 270  77 yes (0.71481481 0.28518519)
      14) company=Chicago Independents,City Service,Sun Taxi,Taxicab Insurance Agency Llc,other 181  38 yes (0.79005525 0.20994475) *
      15) company=Flash Cab,Taxi Affiliation Services 89  39 yes (0.56179775 0.43820225)
        30) dow=Sun,Mon,Wed,Thu,Sat 59  17 yes (0.71186441 0.28813559) *
        31) dow=Tue,Fri 30   8 no (0.26666667 0.73333333) *
workflow方法
<- decision_tree (cost_complexity = 0.002 ) %>% set_mode ("classification" )# 建立一个 workflow,同时保存模型参数,表达式和数据 workflow () %>% add_formula (tip ~ .) %>% add_model (tree_spec) %>% fit (data = taxi_train)
══ Workflow [trained] ══════════════════════════════════════════════════════════
Preprocessor: Formula
Model: decision_tree()

── Preprocessor ────────────────────────────────────────────────────────────────
tip ~ .

── Model ───────────────────────────────────────────────────────────────────────
n= 7500

node), split, n, loss, yval, (yprob)
      * denotes terminal node

 1) root 7500 579 yes (0.92280000 0.07720000)
   2) distance>=11.805 2169  83 yes (0.96173352 0.03826648) *
   3) distance< 11.805 5331 496 yes (0.90695929 0.09304071)
     6) distance< 5.405 5061 419 yes (0.91721004 0.08278996) *
     7) distance>=5.405 270  77 yes (0.71481481 0.28518519)
      14) company=Chicago Independents,City Service,Sun Taxi,Taxicab Insurance Agency Llc,other 181  38 yes (0.79005525 0.20994475) *
      15) company=Flash Cab,Taxi Affiliation Services 89  39 yes (0.56179775 0.43820225)
        30) dow=Sun,Mon,Wed,Thu,Sat 59  17 yes (0.71186441 0.28813559) *
        31) dow=Tue,Fri 30   8 no (0.26666667 0.73333333) *
# 或者写在一起 workflow (tip ~ ., tree_spec) %>% fit (data = taxi_train)
══ Workflow [trained] ══════════════════════════════════════════════════════════
Preprocessor: Formula
Model: decision_tree()

── Preprocessor ────────────────────────────────────────────────────────────────
tip ~ .

── Model ───────────────────────────────────────────────────────────────────────
n= 7500

node), split, n, loss, yval, (yprob)
      * denotes terminal node

 1) root 7500 579 yes (0.92280000 0.07720000)
   2) distance>=11.805 2169  83 yes (0.96173352 0.03826648) *
   3) distance< 11.805 5331 496 yes (0.90695929 0.09304071)
     6) distance< 5.405 5061 419 yes (0.91721004 0.08278996) *
     7) distance>=5.405 270  77 yes (0.71481481 0.28518519)
      14) company=Chicago Independents,City Service,Sun Taxi,Taxicab Insurance Agency Llc,other 181  38 yes (0.79005525 0.20994475) *
      15) company=Flash Cab,Taxi Affiliation Services 89  39 yes (0.56179775 0.43820225)
        30) dow=Sun,Mon,Wed,Thu,Sat 59  17 yes (0.71186441 0.28813559) *
        31) dow=Tue,Fri 30   8 no (0.26666667 0.73333333) *
Edit this code to make a workflow with your own model of choice.
Extension/Challenge: Other than formulas, what kinds of preprocessors are supported?
使用模型预测
推荐使用 augment() 方法进行预测,与传统的 predict() 相比的差异如下。
<- workflow (tip ~ ., tree_spec) %>% fit (data = taxi_train) predict (tree_fit, new_data = taxi_test)
# A tibble: 2,500 × 1
   .pred_class
   <fct>
 1 yes
 2 yes
 3 yes
 4 yes
 5 yes
 6 yes
 7 yes
 8 yes
 9 yes
10 yes
# ℹ 2,490 more rows
augment (tree_fit, new_data = taxi_test)
# A tibble: 2,500 × 10
   tip   distance company local dow   month  hour .pred_class .pred_yes .pred_no
   <fct>    <dbl> <fct>   <fct> <fct> <fct> <int> <fct>           <dbl>    <dbl>
 1 yes       0.94 Sun Ta… yes   Sat   Apr      23 yes             0.917   0.0828
 2 yes       1    Taxi A… no    Mon   Feb      18 yes             0.917   0.0828
 3 yes       1.91 Flash … no    Wed   Apr      15 yes             0.917   0.0828
 4 yes       1.1  Chicag… no    Sat   Mar      10 yes             0.917   0.0828
 5 yes      11.7  other   no    Wed   Mar      18 yes             0.790   0.210
 6 yes      17.8  City S… no    Mon   Mar       9 yes             0.962   0.0383
 7 yes       0.53 Taxica… yes   Wed   Apr       8 yes             0.917   0.0828
 8 yes       1.14 City S… no    Wed   Mar      14 yes             0.917   0.0828
 9 yes       1.77 other   no    Thu   Apr      15 yes             0.917   0.0828
10 yes      18.6  Flash … no    Thu   Apr      12 yes             0.962   0.0383
# ℹ 2,490 more rows
预测结果在一个 tibble 中;
列名和数据类型更加清晰和易于理解;
行数和输出结果的行数是相同的,确保了数据的对应关系。
解释模型
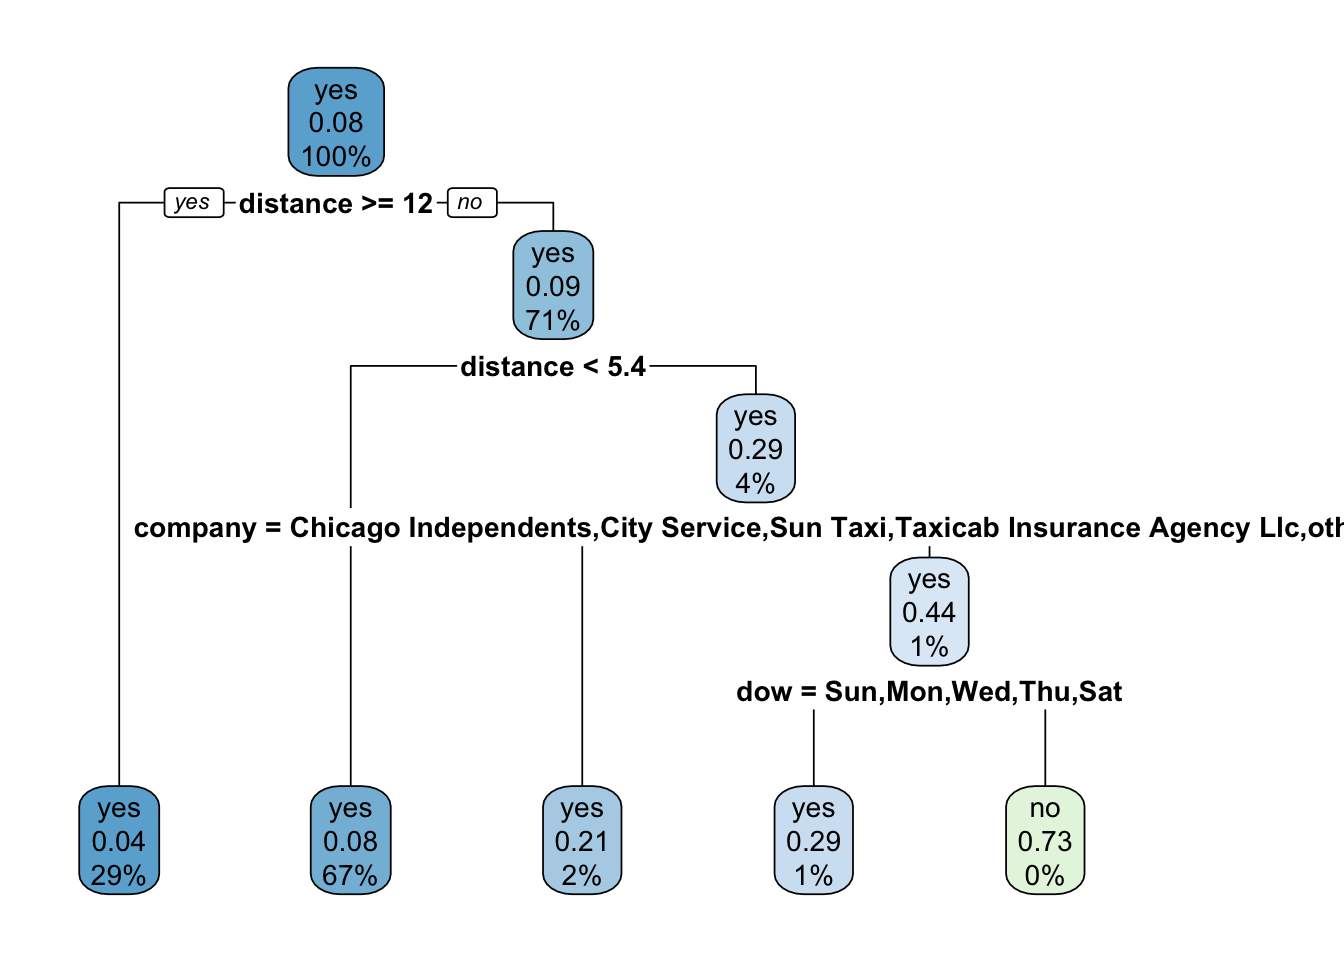
使用 extract_*() 函数提取模型 workflow 对象的组件。如 Figure 1.4 展示了上面决策树模型的分类过程。
library (rpart.plot)%>% extract_fit_engine () %>% rpart.plot (roundint = FALSE )
You can use your fitted workflow for model and/or prediction explanations:
overall variable importance, such as with the vip package
flexible model explainers, such as with the DALEXtra package
模型的评价
先训练一个决策树模型,然后再评价该模型的性能。
library (tidymodels)set.seed (123 )<- initial_split (taxi, prop = 0.8 , strata = tip)<- training (taxi_split)<- testing (taxi_split)<- decision_tree (cost_complexity = 0.0001 , mode = "classification" )<- workflow (tip ~ ., tree_spec)<- fit (taxi_wflow, taxi_train)
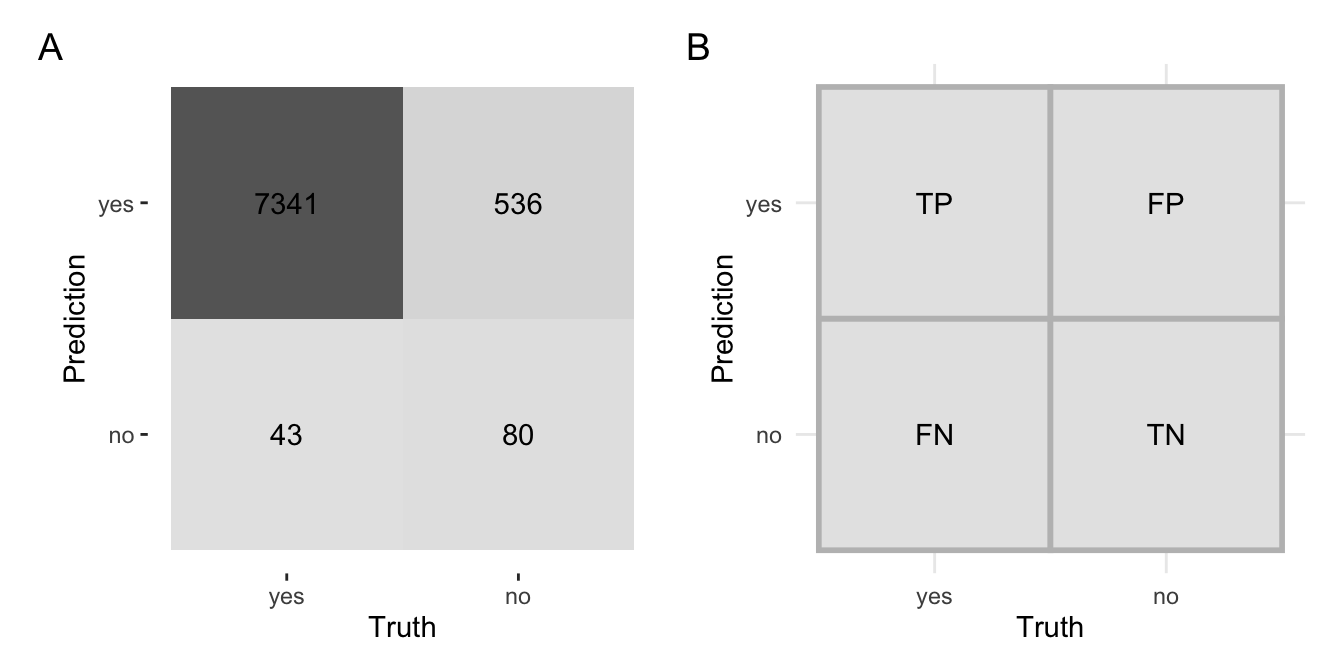
混淆矩阵
混淆矩阵将真实值和预测值以热图的形成呈现出来。
library (ggplot2)library (forcats)= augment (taxi_fit, new_data = taxi_train) %>% conf_mat (truth = tip, estimate = .pred_class) %>% autoplot (type = "heatmap" ) + coord_equal ()# 阳性与阴性 = tibble (Truth = as_factor (c ("yes" ,"yes" ,"no" ,"no" )),Prediction = as_factor (c ("no" ,"yes" ,"no" ,"yes" )),label = c ("FN" ,"TP" ,"TN" ,"FP" ))= ggplot (df, aes (Truth, Prediction, label = label)) + geom_tile (fill = "grey90" , color = "grey" , linewidth = 1 ) + geom_text () + coord_equal () + theme_minimal ():: plot_list (p1, p2, labels = c ("A" ,"B" ))
准确性
根据 Equation 1.1 可以计算准确性为 0.927625。
accuracy = \frac{TP + TN}{TP+FP+TN+FN}
\tag{1.1}
augment (taxi_fit, new_data = taxi_train) %>% accuracy (truth = tip, estimate = .pred_class)
# A tibble: 1 × 3
  .metric  .estimator .estimate
  <chr>    <chr>          <dbl>
1 accuracy binary         0.928
敏感性
根据 Equation 1.2 可以计算其数值为 0.9941766。
sensitivity = \frac{TP}{TP+FP}
\tag{1.2}
augment (taxi_fit, new_data = taxi_train) %>% sensitivity (truth = tip, estimate = .pred_class)
# A tibble: 1 × 3
  .metric     .estimator .estimate
  <chr>       <chr>          <dbl>
1 sensitivity binary         0.994
特异性
根据 Equation 1.3 可以计算其数值为 0.1298701。
sensitivity = \frac{TP}{TP+FP}
\tag{1.3}
augment (taxi_fit, new_data = taxi_train) %>% specificity (truth = tip, estimate = .pred_class)
# A tibble: 1 × 3
  .metric     .estimator .estimate
  <chr>       <chr>          <dbl>
1 specificity binary         0.130
敏感性 告诉我们,测试有多大程度上能够捕捉到真正的阳性实例,即对于实际为阳性的样本,测试有多大可能性能够正确地识别出它们。特异性 告诉我们,测试有多大程度上能够正确地排除实际为阴性的样本,即对于实际为阴性的样本,测试有多大可能性能够正确地将它们识别为阴性。准确率 是一个综合性指标,衡量了分类模型对于所有样本的整体预测准确性。具体而言,它表示模型正确预测的样本在所有样本中的比例。
使用 metric_set() 可以一次获取多个指标(另见 Figure 1.6 )。
<- metric_set (accuracy, specificity, sensitivity)augment (taxi_fit, new_data = taxi_train) %>% taxi_metrics (truth = tip, estimate = .pred_class)
# A tibble: 3 × 3
  .metric     .estimator .estimate
  <chr>       <chr>          <dbl>
1 accuracy    binary         0.928
2 specificity binary         0.130
3 sensitivity binary         0.994
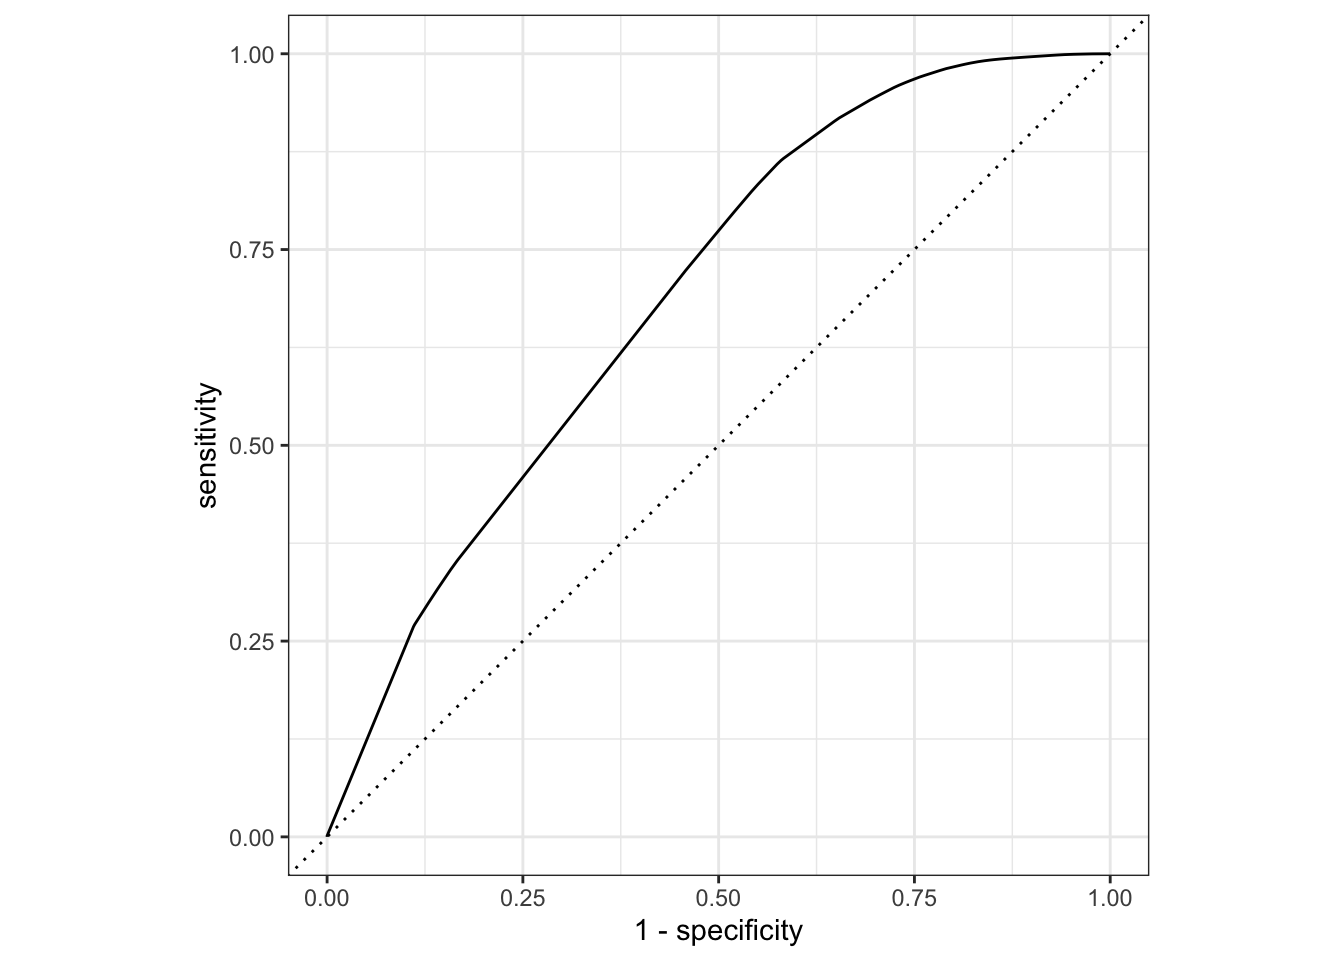
ROC 曲线
ROC(Receiver Operating Characteristic)曲线是一种用于评估二分类模型性能的图形工具。以下是关于ROC曲线的定义和解释:
定义 :
ROC曲线是一种以假正例率(False Positive Rate,FPR)为横轴、真正例率(True Positive Rate,TPR或敏感性)为纵轴的图形。它显示了在不同阈值下,模型的真正例率和假正例率之间的权衡关系。
绘制方式 :
在ROC曲线中,横轴表示FPR,纵轴表示TPR。模型的输出概率或分数被用作不同阈值,从而生成一系列的TPR和FPR值。
解释 :
ROC曲线能够展示在不同分类阈值下,模型在识别正例(阳性类别)和负例(阴性类别)方面的性能。理想情况下,ROC曲线越靠近左上角,模型性能越好,因为在那里,TPR较高而FPR较低。
AUC值 :
ROC曲线下的面积(Area Under the Curve,AUC)也是一个常用的性能度量。AUC值越接近1,表示模型性能越好。AUC值为0.5时,表示模型的性能等同于随机猜测。
示例 :
一个理想的ROC曲线会沿着左上角的边缘,最终达到(0, 1)点。一般情况下,ROC曲线在图形上是向左上凸起的。
在实际应用中,ROC曲线和AUC值是评估分类模型性能的重要工具,尤其在处理不同类别分布和不同阈值的情况下。
given that sensitivity is the true positive rate, and specificity is the true negative rate. Hence 1 - specificity is the false positive rate.
We can use the area under the ROC curve as a classification metric:
ROC AUC = 1 💯
ROC AUC = 1/2 😢
# Assumes _first_ factor level is event; there are options to change that augment (taxi_fit, new_data = taxi_train) %>% roc_curve (truth = tip, .pred_yes) %>% slice (1 , 20 , 50 )
# A tibble: 3 × 3
  .threshold specificity sensitivity
       <dbl>       <dbl>       <dbl>
1   -Inf           0         1
2      0.783       0.209     0.981
3      1           1         0.00135
augment (taxi_fit, new_data = taxi_train) %>% roc_auc (truth = tip, .pred_yes)
# A tibble: 1 × 3
  .metric .estimator .estimate
  <chr>   <chr>          <dbl>
1 roc_auc binary         0.691
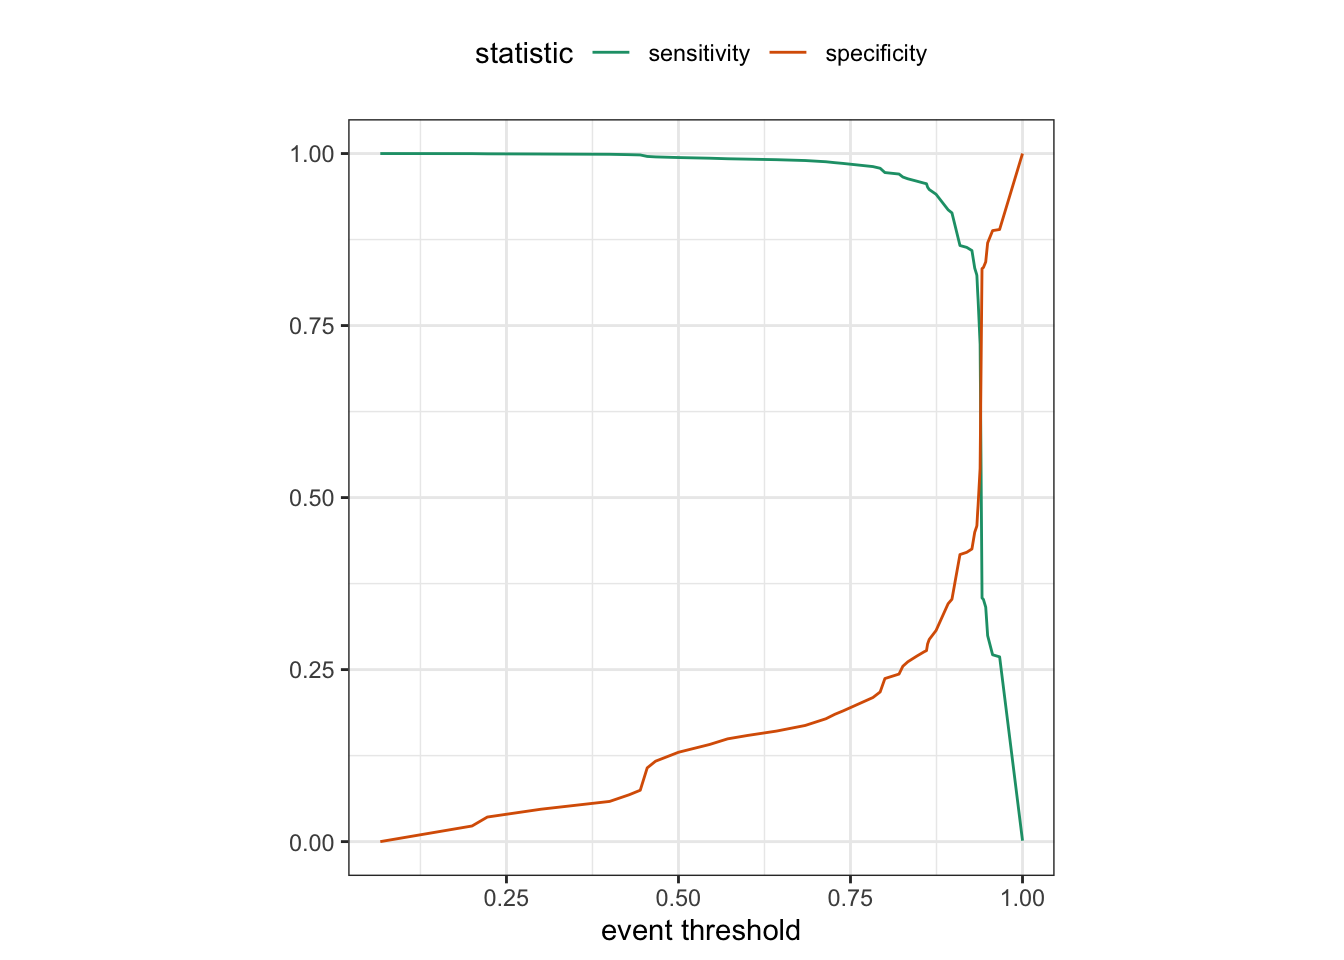
Figure 1.7 显示了上面这个模型的 ROC 曲线。
augment (taxi_fit, new_data = taxi_train) %>% roc_curve (truth = tip, .pred_yes) %>% autoplot ()
过拟合
将训练得到的模型分别用于训练数据集和测试数据集,比较二者预测的准确率,可以发现预测训练数据集的结果优于测试数据集。这就是模型的过拟合现象(Figure 1.8 )。
首先,比较一下模型的准确性指标。
# 模型预测训练数据集 %>% augment (taxi_train) %>% accuracy (tip, .pred_class)
# A tibble: 1 × 3
  .metric  .estimator .estimate
  <chr>    <chr>          <dbl>
1 accuracy binary         0.928
# 模型预测测试数据集 %>% augment (taxi_test) %>% accuracy (tip, .pred_class)
# A tibble: 1 × 3
  .metric  .estimator .estimate
  <chr>    <chr>          <dbl>
1 accuracy binary         0.908
其次,比较一下 Brier 分数。
%>% augment (taxi_train) %>% brier_class (tip, .pred_yes)
# A tibble: 1 × 3
  .metric     .estimator .estimate
  <chr>       <chr>          <dbl>
1 brier_class binary        0.0632
%>% augment (taxi_test) %>% brier_class (tip, .pred_yes)
# A tibble: 1 × 3
  .metric     .estimator .estimate
  <chr>       <chr>          <dbl>
1 brier_class binary        0.0782
Brier分数(Brier Score)是一种用于评估分类模型性能的指标。对于二分类问题,Brier分数的计算公式如下:
Brier\ Score = \frac{1}{N} \sum_{i=1}^{N} (f_i - o_i)^2
其中:
N 是样本数;f_i 是模型对事件发生的概率的预测值;o_i 是实际观测到的二分类结果,取值为0或1(例如,事件未发生为0,事件发生为1)。
Brier分数的取值范围在0到1之间,0表示完美预测,1表示最差的预测。较低的Brier分数表示模型对观测结果的概率预测更准确。所以,仍然可以发现模型过拟合的现象。
交叉验证
在不使用测试数据集的前提下,能不能比较模型的参数?这就要用到交叉验证。vfold_cv() 函数默认将训练数据集中的十分之一(v = 10)取出来,用于计算、比较模型的性能参数。
set.seed (123 )<- vfold_cv (taxi_train, v = 10 , strata = tip)
#  10-fold cross-validation using stratification
# A tibble: 10 × 2
   splits             id
   <list>             <chr>
 1 <split [7200/800]> Fold01
 2 <split [7200/800]> Fold02
 3 <split [7200/800]> Fold03
 4 <split [7200/800]> Fold04
 5 <split [7200/800]> Fold05
 6 <split [7200/800]> Fold06
 7 <split [7200/800]> Fold07
 8 <split [7200/800]> Fold08
 9 <split [7200/800]> Fold09
10 <split [7200/800]> Fold10
使用 fit_resamples() 函数来对多次取样的数据进行拟合,使用 collect_mertics() 评价模型的性能。
<- fit_resamples (taxi_wflow, taxi_folds)
# Resampling results
# 10-fold cross-validation using stratification
# A tibble: 10 × 4
   splits             id     .metrics         .notes
   <list>             <chr>  <list>           <list>
 1 <split [7200/800]> Fold01 <tibble [2 × 4]> <tibble [0 × 3]>
 2 <split [7200/800]> Fold02 <tibble [2 × 4]> <tibble [0 × 3]>
 3 <split [7200/800]> Fold03 <tibble [2 × 4]> <tibble [0 × 3]>
 4 <split [7200/800]> Fold04 <tibble [2 × 4]> <tibble [0 × 3]>
 5 <split [7200/800]> Fold05 <tibble [2 × 4]> <tibble [0 × 3]>
 6 <split [7200/800]> Fold06 <tibble [2 × 4]> <tibble [0 × 3]>
 7 <split [7200/800]> Fold07 <tibble [2 × 4]> <tibble [0 × 3]>
 8 <split [7200/800]> Fold08 <tibble [2 × 4]> <tibble [0 × 3]>
 9 <split [7200/800]> Fold09 <tibble [2 × 4]> <tibble [0 × 3]>
10 <split [7200/800]> Fold10 <tibble [2 × 4]> <tibble [0 × 3]>
%>% collect_metrics ()
# A tibble: 2 × 6
  .metric  .estimator  mean     n std_err .config
  <chr>    <chr>      <dbl> <int>   <dbl> <chr>
1 accuracy binary     0.915    10 0.00309 Preprocessor1_Model1
2 roc_auc  binary     0.624    10 0.0105  Preprocessor1_Model1
collect_metrics() is one of a suite of collect_*() functions that can be used to work with columns of tuning results. Most columns in a tuning result prefixed with . have a corresponding collect_*() function with options for common summaries.
交叉验证通过重采样和性能比较,使得我们可以在仅使用训练集就可以可靠地比较模型的性能。
# Save the assessment set results <- control_resamples (save_pred = TRUE )<- fit_resamples (taxi_wflow, taxi_folds, control = ctrl_taxi)
# Resampling results
# 10-fold cross-validation using stratification
# A tibble: 10 × 5
   splits             id     .metrics         .notes           .predictions
   <list>             <chr>  <list>           <list>           <list>
 1 <split [7200/800]> Fold01 <tibble [2 × 4]> <tibble [0 × 3]> <tibble>
 2 <split [7200/800]> Fold02 <tibble [2 × 4]> <tibble [0 × 3]> <tibble>
 3 <split [7200/800]> Fold03 <tibble [2 × 4]> <tibble [0 × 3]> <tibble>
 4 <split [7200/800]> Fold04 <tibble [2 × 4]> <tibble [0 × 3]> <tibble>
 5 <split [7200/800]> Fold05 <tibble [2 × 4]> <tibble [0 × 3]> <tibble>
 6 <split [7200/800]> Fold06 <tibble [2 × 4]> <tibble [0 × 3]> <tibble>
 7 <split [7200/800]> Fold07 <tibble [2 × 4]> <tibble [0 × 3]> <tibble>
 8 <split [7200/800]> Fold08 <tibble [2 × 4]> <tibble [0 × 3]> <tibble>
 9 <split [7200/800]> Fold09 <tibble [2 × 4]> <tibble [0 × 3]> <tibble>
10 <split [7200/800]> Fold10 <tibble [2 × 4]> <tibble [0 × 3]> <tibble>
# Save the assessment set results <- collect_predictions (taxi_res)
# A tibble: 8,000 × 7
   id     .pred_yes .pred_no  .row .pred_class tip   .config
   <chr>      <dbl>    <dbl> <int> <fct>       <fct> <chr>
 1 Fold01     0.938   0.0615    14 yes         yes   Preprocessor1_Model1
 2 Fold01     0.946   0.0544    19 yes         yes   Preprocessor1_Model1
 3 Fold01     0.973   0.0269    33 yes         yes   Preprocessor1_Model1
 4 Fold01     0.903   0.0971    43 yes         yes   Preprocessor1_Model1
 5 Fold01     0.973   0.0269    74 yes         yes   Preprocessor1_Model1
 6 Fold01     0.903   0.0971   103 yes         yes   Preprocessor1_Model1
 7 Fold01     0.915   0.0851   104 yes         no    Preprocessor1_Model1
 8 Fold01     0.903   0.0971   124 yes         yes   Preprocessor1_Model1
 9 Fold01     0.667   0.333    126 yes         yes   Preprocessor1_Model1
10 Fold01     0.949   0.0510   128 yes         yes   Preprocessor1_Model1
# ℹ 7,990 more rows
# Evaluating model performance %>% group_by (id) %>% taxi_metrics (truth = tip, estimate = .pred_class)
# A tibble: 30 × 4
   id     .metric  .estimator .estimate
   <chr>  <chr>    <chr>          <dbl>
 1 Fold01 accuracy binary         0.905
 2 Fold02 accuracy binary         0.925
 3 Fold03 accuracy binary         0.926
 4 Fold04 accuracy binary         0.915
 5 Fold05 accuracy binary         0.902
 6 Fold06 accuracy binary         0.912
 7 Fold07 accuracy binary         0.906
 8 Fold08 accuracy binary         0.91
 9 Fold09 accuracy binary         0.918
10 Fold10 accuracy binary         0.931
# ℹ 20 more rows
# Resampling results
# 10-fold cross-validation using stratification
# A tibble: 10 × 5
   splits             id     .metrics         .notes           .predictions
   <list>             <chr>  <list>           <list>           <list>
 1 <split [7200/800]> Fold01 <tibble [2 × 4]> <tibble [0 × 3]> <tibble>
 2 <split [7200/800]> Fold02 <tibble [2 × 4]> <tibble [0 × 3]> <tibble>
 3 <split [7200/800]> Fold03 <tibble [2 × 4]> <tibble [0 × 3]> <tibble>
 4 <split [7200/800]> Fold04 <tibble [2 × 4]> <tibble [0 × 3]> <tibble>
 5 <split [7200/800]> Fold05 <tibble [2 × 4]> <tibble [0 × 3]> <tibble>
 6 <split [7200/800]> Fold06 <tibble [2 × 4]> <tibble [0 × 3]> <tibble>
 7 <split [7200/800]> Fold07 <tibble [2 × 4]> <tibble [0 × 3]> <tibble>
 8 <split [7200/800]> Fold08 <tibble [2 × 4]> <tibble [0 × 3]> <tibble>
 9 <split [7200/800]> Fold09 <tibble [2 × 4]> <tibble [0 × 3]> <tibble>
10 <split [7200/800]> Fold10 <tibble [2 × 4]> <tibble [0 × 3]> <tibble>
交叉验证的蒙特卡洛方法,以及创建验证数据集。
set.seed (322 )# use the Monte Carlo Cross-Validation mc_cv (taxi_train, times = 10 )
# Monte Carlo cross-validation (0.75/0.25) with 10 resamples
# A tibble: 10 × 2
   splits              id
   <list>              <chr>
 1 <split [6000/2000]> Resample01
 2 <split [6000/2000]> Resample02
 3 <split [6000/2000]> Resample03
 4 <split [6000/2000]> Resample04
 5 <split [6000/2000]> Resample05
 6 <split [6000/2000]> Resample06
 7 <split [6000/2000]> Resample07
 8 <split [6000/2000]> Resample08
 9 <split [6000/2000]> Resample09
10 <split [6000/2000]> Resample10
# create validation set <- initial_validation_split (taxi, strata = tip)validation_set (taxi_val_split)
# A tibble: 1 × 2
  splits              id
  <list>              <chr>
1 <split [6000/2000]> validation
随机森林模型
在了解了模型评价指标之后,我们再建一个随机森林模型,看看这个模型的性能是不是会优于决策树。
随机森林(Random Forest)是一种集成学习(Ensemble Learning)方法,用于解决分类和回归问题。它建立在决策树的基础上,通过构建多个决策树并结合它们的预测结果来提高模型的性能和鲁棒性。
以下是随机森林模型的主要特点和工作原理:
决策树基学习器: 随机森林由多个决策树组成。每个决策树都是独立训练的,采用不同的随机子集数据。这有助于防止过拟合,增加模型的泛化能力。
随机子集(Bootstrap抽样): 在训练每个决策树时,随机森林使用自助抽样(Bootstrap Sampling)从训练集中随机选择一个子集。这意味着每个决策树的训练数据都是从原始训练集中有放回地随机抽取的。
随机特征选择: 在每个决策树的节点上,随机森林只考虑特征的随机子集进行划分。这样做有助于确保每个决策树的多样性,防止所有决策树过于相似。
投票机制: 对于分类问题,随机森林通过多数投票原则(Majority Voting)来确定最终的分类结果。对于回归问题,随机森林取多个决策树的平均预测结果。
高性能和鲁棒性: 随机森林通常对于各种类型的数据和问题都表现得很好。它们能够处理大量特征和样本,具有较强的鲁棒性,对于处理噪声和复杂关系也有良好的适应性。
随机森林的主要优势在于其简单而强大的集成学习策略,能够有效地降低过拟合风险,并在许多实际应用中表现优异。由于其可解释性、鲁棒性和高性能,随机森林成为了许多数据科学和机器学习问题的首选模型之一。
Bootstrap aggregating,通常简称为 Bagging,是一种集成学习的方法,旨在提高模型的稳定性和准确性。它的核心思想是通过对原始数据集进行自助抽样(Bootstrap Sampling),创建多个数据子集,然后分别训练多个模型,最后将它们的预测结果进行组合。
下面使用随机森林模型建模,并检查得到模型的性能指标。
# initialize a random forest model <- rand_forest (trees = 1000 , mode = "classification" )
Random Forest Model Specification (classification)

Main Arguments:
  trees = 1000

Computational engine: ranger
# Create a random forest model (workflow) <- workflow (tip ~ ., rf_spec)
══ Workflow ════════════════════════════════════════════════════════════════════
Preprocessor: Formula
Model: rand_forest()

── Preprocessor ────────────────────────────────────────────────────────────────
tip ~ .

── Model ───────────────────────────────────────────────────────────────────────
Random Forest Model Specification (classification)

Main Arguments:
  trees = 1000

Computational engine: ranger
<- control_resamples (save_pred = TRUE )# Random forest uses random numbers so set the seed first set.seed (2 )= vfold_cv (taxi_train, strata = tip)<- fit_resamples (rf_wflow, taxi_folds, control = ctrl_taxi)collect_metrics (rf_res)
# A tibble: 2 × 6
  .metric  .estimator  mean     n std_err .config
  <chr>    <chr>      <dbl> <int>   <dbl> <chr>
1 accuracy binary     0.923    10 0.00336 Preprocessor1_Model1
2 roc_auc  binary     0.612    10 0.0178  Preprocessor1_Model1
# taxi_split has train + test info <- last_fit (rf_wflow, taxi_split)
# Resampling results
# Manual resampling
# A tibble: 1 × 6
  splits              id               .metrics .notes   .predictions .workflow
  <list>              <chr>            <list>   <list>   <list>       <list>
1 <split [8000/2000]> train/test split <tibble> <tibble> <tibble>     <workflow>
## What is in final_fit collect_metrics (final_fit)
# A tibble: 2 × 4
  .metric  .estimator .estimate .config
  <chr>    <chr>          <dbl> <chr>
1 accuracy binary         0.914 Preprocessor1_Model1
2 roc_auc  binary         0.644 Preprocessor1_Model1
# metrics computed with the test set collect_predictions (final_fit)
# A tibble: 2,000 × 7
   id               .pred_yes .pred_no  .row .pred_class tip   .config
   <chr>                <dbl>    <dbl> <int> <fct>       <fct> <chr>
 1 train/test split     0.958  0.0415      4 yes         yes   Preprocessor1_Mo…
 2 train/test split     0.931  0.0689     10 yes         yes   Preprocessor1_Mo…
 3 train/test split     0.969  0.0313     19 yes         yes   Preprocessor1_Mo…
 4 train/test split     0.889  0.111      23 yes         yes   Preprocessor1_Mo…
 5 train/test split     0.945  0.0551     28 yes         yes   Preprocessor1_Mo…
 6 train/test split     0.981  0.0193     34 yes         yes   Preprocessor1_Mo…
 7 train/test split     0.952  0.0476     35 yes         yes   Preprocessor1_Mo…
 8 train/test split     0.936  0.0637     38 yes         yes   Preprocessor1_Mo…
 9 train/test split     0.991  0.00895    40 yes         yes   Preprocessor1_Mo…
10 train/test split     0.947  0.0526     42 yes         no    Preprocessor1_Mo…
# ℹ 1,990 more rows
## What is in final_fit extract_workflow (final_fit)
══ Workflow [trained] ══════════════════════════════════════════════════════════
Preprocessor: Formula
Model: rand_forest()

── Preprocessor ────────────────────────────────────────────────────────────────
tip ~ .

── Model ───────────────────────────────────────────────────────────────────────
Ranger result

Call:
 ranger::ranger(x = maybe_data_frame(x), y = y, num.trees = ~1000,      num.threads = 1, verbose = FALSE, seed = sample.int(10^5,          1), probability = TRUE)

Type:                             Probability estimation
Number of trees:                  1000
Sample size:                      8000
Number of independent variables:  6
Mtry:                             2
Target node size:                 10
Variable importance mode:         none
Splitrule:                        gini
OOB prediction error (Brier s.):  0.07054061
模型的调优
为什么要调优?
模型调整(tuning)是机器学习中的一个重要步骤,主要出于以下几个原因:
提高模型性能 :调整模型参数可以帮助我们找到最优的参数组合,从而使模型在特定任务上实现最佳性能。
避免过拟合和欠拟合 :通过适当的模型调整,我们可以平衡模型的偏差和方差,避免过拟合(模型在训练数据上表现良好,但在测试数据上表现差)和欠拟合(模型在训练数据和测试数据上的表现都不好)。
适应不同的数据分布 :不同的数据集有其特异性,可能需要不同的参数配置才能达到较好的效果。通过模型调度,我们可以针对具体的数据集优化模型。
增加模型的泛化能力 :通过合理的参数设置,可以使模型对未知数据有更好的预测能力。
适用的情况
模型调优主要适用于以下几种情况:
模型性能不佳 :当模型的预测结果或分类效果不尽如人意时,我们需要对模型进行调优以提升其性能。
数据集特性变化 :当我们处理的数据集有显著的特性变化(例如特征分布改变,噪声增加等)时,我们需要对原有模型进行调整以适应新的数据特性。
模型过拟合或欠拟合 :当模型在训练集上表现良好,但在测试集上表现较差(过拟合),或者模型在训练集和测试集上的表现都不佳(欠拟合)时,我们需要通过调整模型参数来解决这些问题。
初始参数设置不合理 :如果模型的初始参数设置并不合适,可能会导致模型的学习效率较低或者无法到达最优解,此时需要对模型进行调优。
针对特定任务优化模型 :当我们希望模型在某个特定任务上有更好的表现时,我们可以对模型做针对性的调优。
总的来说,只要是希望提升模型性能,适应数据变化,或者解决模型的过拟合和欠拟合问题,我们都可以通过模型调优来实现。
常见策略
最常见的模型调优策略主要有以下几种:
网格搜索(Grid Search) :这是一种穷举搜索的方法,我们为每一个参数设定一组值,然后通过遍历每个参数可能的组合来寻找最优解。
随机搜索(Random Search) :不同于网格搜索的穷举性质,它在每个参数的可能值中随机选取一部分进行组合,然后从这些组合中寻找最优解。
手动搜索(Manual Search) :也称为人工搜索,即由研究者根据经验或者对问题的理解,手动设定并调整参数。这种方式需要有一定的专业知识和经验,但在某些情况下可能会找到更好的解。
自动化搜索(Automated Search) :这类方法,如贝叶斯优化、遗传算法等,使用算法自动寻找最优参数组合。相比前面几种方法,这些方法可以在更大的范围内寻找最优参数,并且节省了人工参与调整的时间。
以上就是目前最常用的模型调优策略,选择哪种策略依赖于具体的需求、问题复杂度以及可用资源。
调优模型
tune_grid() works similar to fit_resamples() but covers multiple parameter values:
<- rand_forest (min_n = tune ()) %>% set_mode ("classification" )<- workflow (tip ~ ., rf_spec)
══ Workflow ════════════════════════════════════════════════════════════════════
Preprocessor: Formula
Model: rand_forest()

── Preprocessor ────────────────────────────────────────────────────────────────
tip ~ .

── Model ───────────────────────────────────────────────────────────────────────
Random Forest Model Specification (classification)

Main Arguments:
  min_n = tune()

Computational engine: ranger
## Try out multiple values set.seed (22 )<- tune_grid (grid = 5 ## Compare results # Inspecting results and selecting the best-performing hyperparameter(s): show_best (rf_res)
Warning: No value of `metric` was given; metric 'roc_auc' will be used.
# A tibble: 5 × 7
  min_n .metric .estimator  mean     n std_err .config
  <int> <chr>   <chr>      <dbl> <int>   <dbl> <chr>
1    33 roc_auc binary     0.620    10  0.0157 Preprocessor1_Model1
2    31 roc_auc binary     0.619    10  0.0163 Preprocessor1_Model3
3    21 roc_auc binary     0.614    10  0.0169 Preprocessor1_Model4
4     6 roc_auc binary     0.613    10  0.0180 Preprocessor1_Model2
5    13 roc_auc binary     0.608    10  0.0186 Preprocessor1_Model5
<- select_best (rf_res)
Warning: No value of `metric` was given; metric 'roc_auc' will be used.
# A tibble: 1 × 2
  min_n .config
  <int> <chr>
1    33 Preprocessor1_Model1
## The final fit <- finalize_workflow (rf_wflow, best_parameter))
══ Workflow ════════════════════════════════════════════════════════════════════
Preprocessor: Formula
Model: rand_forest()

── Preprocessor ────────────────────────────────────────────────────────────────
tip ~ .

── Model ───────────────────────────────────────────────────────────────────────
Random Forest Model Specification (classification)

Main Arguments:
  min_n = 33

Computational engine: ranger
<- last_fit (rf_wflow, taxi_split))
# Resampling results
# Manual resampling
# A tibble: 1 × 6
  splits              id               .metrics .notes   .predictions .workflow
  <list>              <chr>            <list>   <list>   <list>       <list>
1 <split [8000/2000]> train/test split <tibble> <tibble> <tibble>     <workflow>
collect_metrics (final_fit)
# A tibble: 2 × 4
  .metric  .estimator .estimate .config
  <chr>    <chr>          <dbl> <chr>
1 accuracy binary         0.913 Preprocessor1_Model1
2 roc_auc  binary         0.648 Preprocessor1_Model1
这段代码是在使用 tidymodels 包中的函数进行随机森林模型的参数调优和最后的拟合。下面是对各个部分的解释:
rf_spec <- rand_forest(min_n = tune()) %>% set_mode("classification")
这行代码定义了一个随机森林分类器,并设定 min_n 参数为待调整的参数。
rf_wflow <- workflow(tip ~ ., rf_spec)
这行代码创建了一个工作流,将特征和模型规格结合起来。
rf_res <- tune_grid(rf_wflow, taxi_folds, grid = 5)
这行代码使用 tune_grid 函数在预定义的交叉验证折叠 taxi_folds 上进行网格搜索,尝试 grid=5 指定的不同的 min_n 参数值。
show_best(rf_res)
这行代码显示了最佳性能的模型参数。
best_parameter <- select_best(rf_res)
这行代码选择出表现最好的模型参数。
rf_wflow <- finalize_workflow(rf_wflow, best_parameter)
这行代码将最佳参数设置到工作流中。
final_fit <- last_fit(rf_wflow, taxi_split)
这行代码在训练集上用确定的最佳参数进行最后的模型拟合。
collect_metrics(final_fit)
这行代码收集并显示最终模型在训练集和测试集上的性能指标。

