This function generate a upset plot by creating a composite plot which contains subplots generated by ggplot2.
plot_upset(
  venn,
  nintersects = NULL,
  order.intersect.by = c("size", "name", "none"),
  order.set.by = c("size", "name", "none"),
  relative_height = 3,
  relative_width = 0.3,
  top.bar.color = "grey30",
  top.bar.y.label = NULL,
  top.bar.show.numbers = TRUE,
  top.bar.numbers.size = 3,
  sets.bar.color = "grey30",
  sets.bar.show.numbers = FALSE,
  sets.bar.numbers.size = 3,
  sets.bar.numbers.hjust = 1.2,
  sets.bar.x.label = "Set Size",
  sets.bar.position = c("left", "right"),
  intersection.matrix.color = "grey30",
  specific = TRUE,
  ...
)
Arguments
- venn
a class Venn object
- nintersects
number of intersects. If NULL, all intersections will show.
- order.intersect.by
'size', 'name', or "none"
- order.set.by
'size', 'name', or "none"
- relative_height
the relative height of top panel in upset plot
- relative_width
the relative width of left panel in upset plot
- top.bar.color
default is "grey30"
- top.bar.y.label
default is NULL
- top.bar.show.numbers
default is TRUE
- top.bar.numbers.size
text size of numbers
- sets.bar.color
default is "grey30"
- sets.bar.show.numbers
default is FALSE
- sets.bar.numbers.size
text size of set bar numbers, default is 3
- sets.bar.numbers.hjust
horizontal justification for set bar numbers. Values > 1 position numbers outside the bars (to the left), values < 1 position numbers inside the bars. Default is 1.2 (outside).
- sets.bar.x.label
default is "Set Size"
- sets.bar.position
the bar plot position of sets ["left"]
- intersection.matrix.color
default is "grey30"
- specific
whether only include specific items in subsets, default is TRUE.
- ...
useless
Value
an upset plot
Examples
list = list(A = sample(LETTERS, 20),
B = sample(LETTERS, 22),
C = sample(LETTERS, 14),
D = sample(LETTERS, 30, replace = TRUE))
venn = Venn(list)
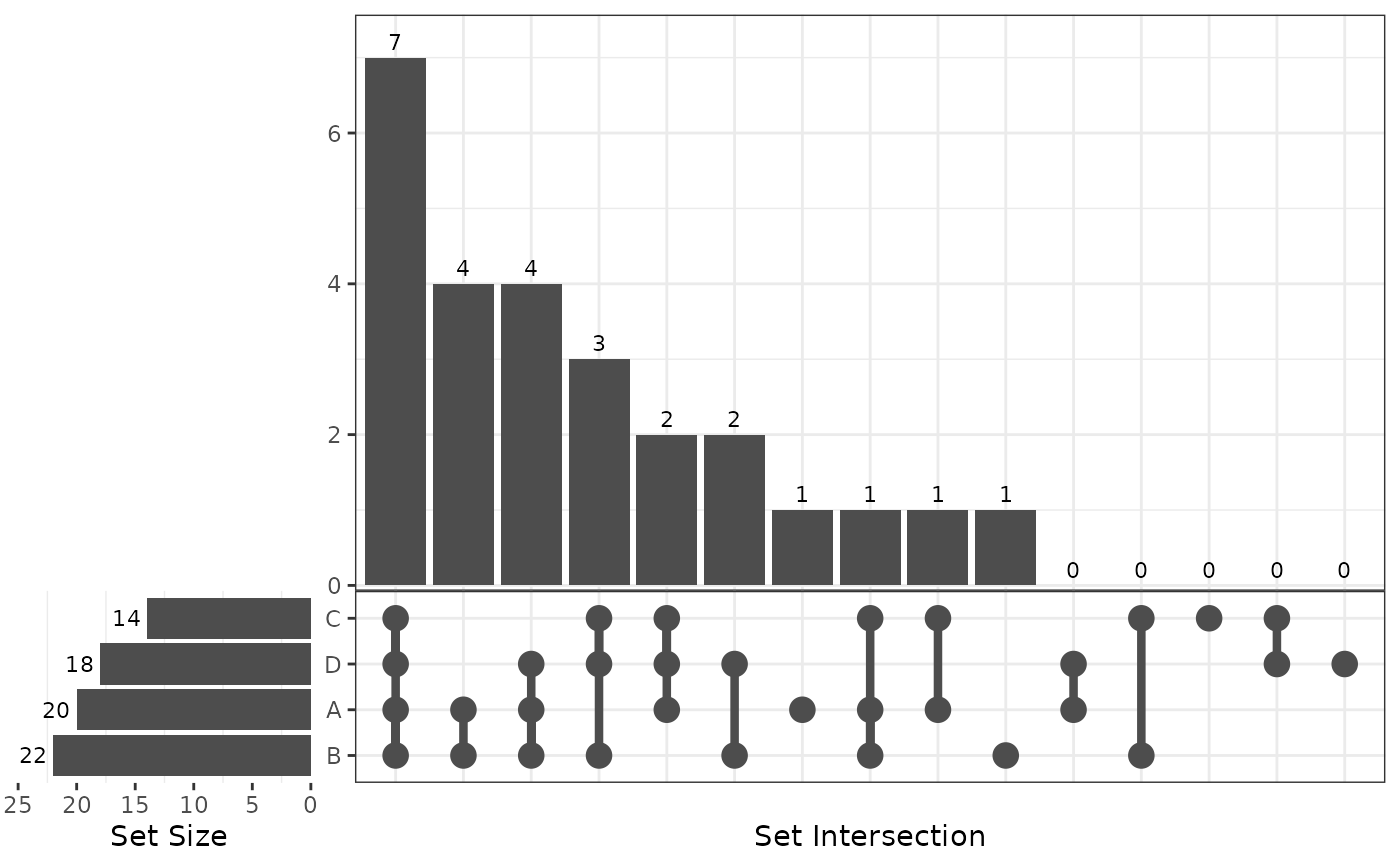
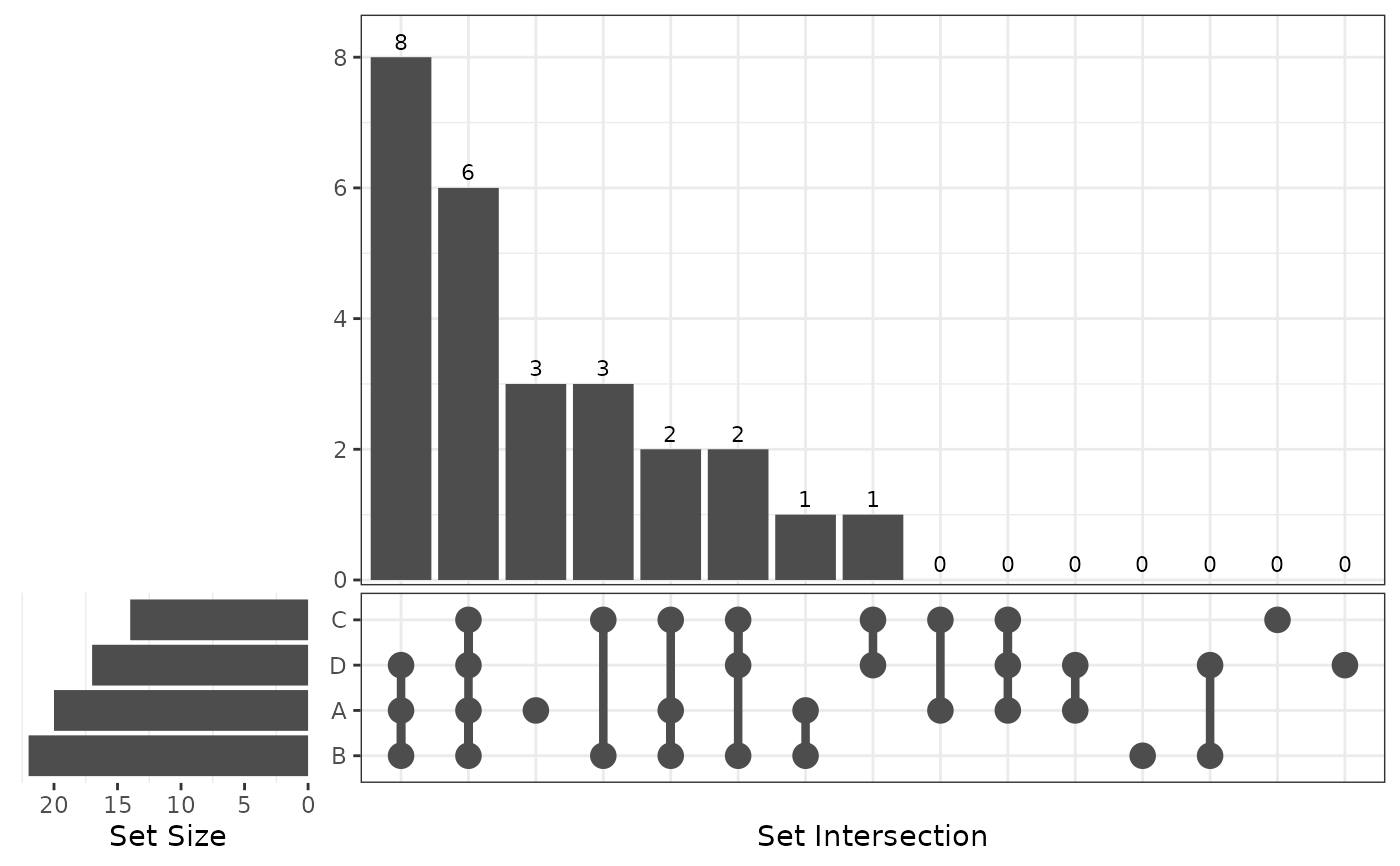
plot_upset(venn)
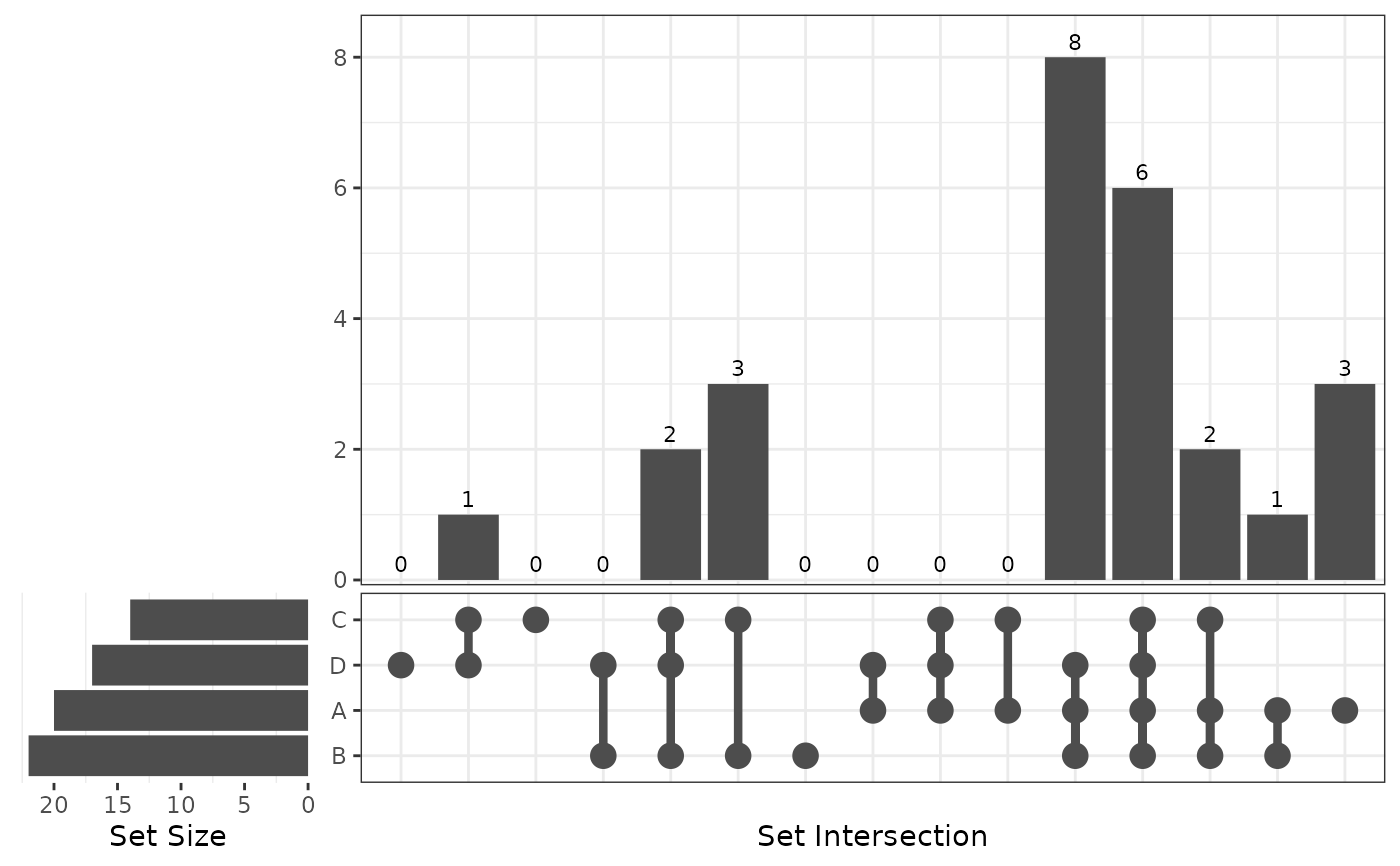
 plot_upset(venn, order.intersect.by = "name")
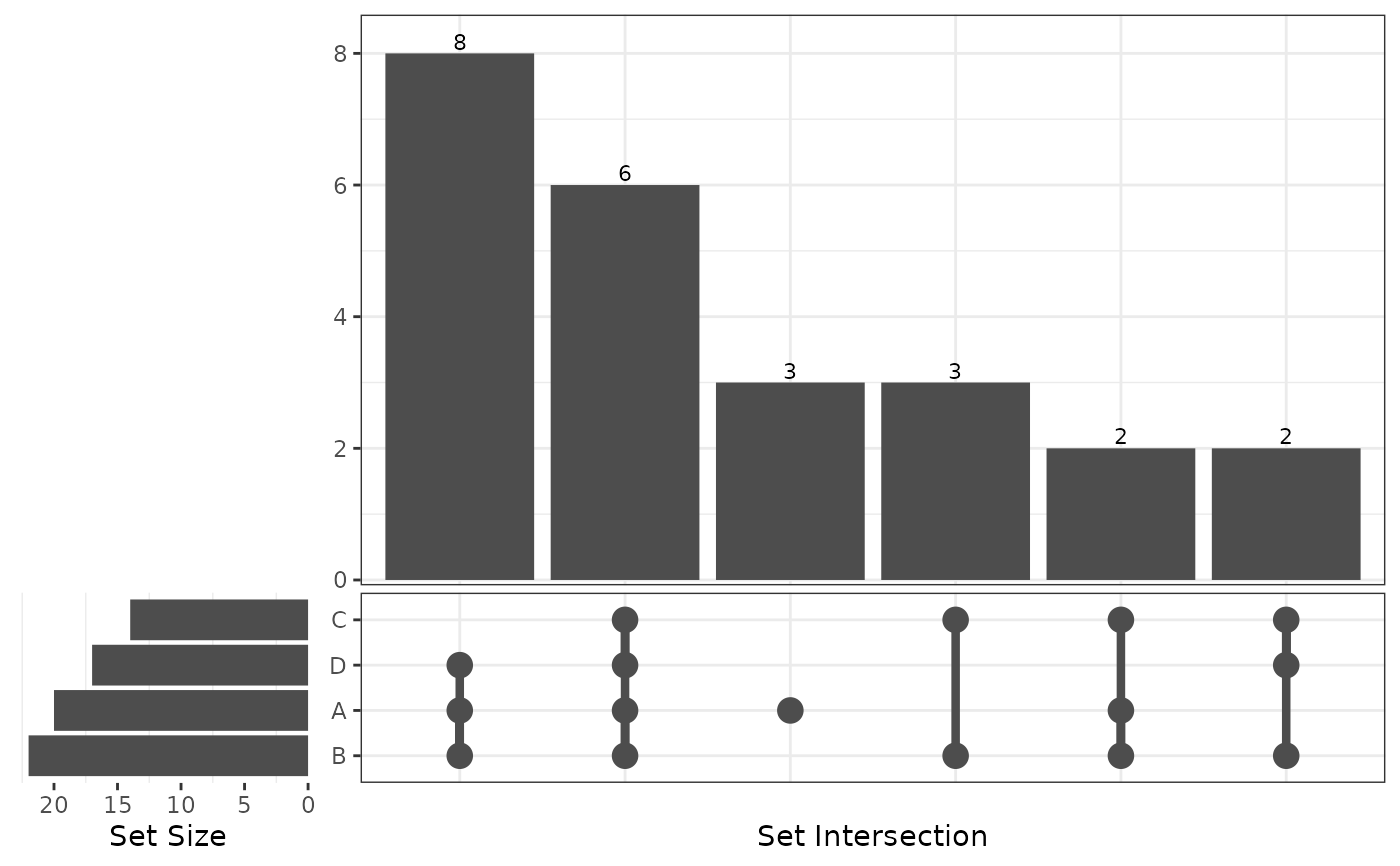
 plot_upset(venn, nintersects = 6)
 # Show set bar numbers outside the bars
plot_upset(venn, sets.bar.show.numbers = TRUE, sets.bar.numbers.hjust = 1.2)
# Show set bar numbers outside the bars
plot_upset(venn, sets.bar.show.numbers = TRUE, sets.bar.numbers.hjust = 1.2)